The aisle length is the distance between the front end and the rear end of
one aisle in the warehouse, this does not include the width of the
(potential) cross aisle(s).
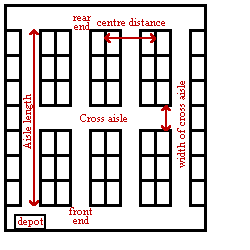
This is the distance between the centre of one aisle and the centre of the
next aisle.
The total width of the warehouse is the number of aisles multiplied by the
centre distance between aisles.
The number of aisles is the number of aisles, in which one picker collects
items. This means that this picker is allowed to pick anywhere in these
aisles.
A cross aisle is an aisle which is perpendicular to the storage aisles in
which the items can be picked (the pick aisle). Its main function is to
enable aisle changing. A cross aisle crosses the pick aisles.
The width of a cross aisle is the distance of the interruption of the pick
aisles, thus the distance between the left side and the right side of the
cross aisle.
The depot location is the point in the warehouse where the pickers start and
end their routes (a path in which all items are retrieved) through the
warehouse. The depot is visited to receive the pick list, pick up an empty
pick device, to drop off the collected orders and/or to continue the pick.
The depot can be situated at the left side, the right side or in the middle
of the front end of the warehouse.
The average speed inside and/or outside the aisles is the velocity at which
the orderpicking vehicle travels on average, this includes accelerating,
decelerating and stopping. Of course, this speed depends on the material
handling equipment you are using in your warehouse. There will not be very
large differences between the speed inside or outside the aisles, but if the
trucks in a narrow aisle warehouse are guided by rails, the speed inside the
aisles will be higher than the speed outside the aisles.
The additional time to change aisles is the time needed to go from one aisle
to another on top of the normal travel time it takes to cover the distance.
If the distance between two aisles is 10 metre and the speed outside the
aisles is 1 m/s, then it would take about 10 seconds to leave the first
aisle and enter the next. If it takes 20 seconds to change aisles actually,
then the additional time to change aisles is 10 seconds. Especially in
narrow aisle warehouses this additional time may occur due to the truck
backing in and out the aisle. It may be as much as half a minute. In the
other types of warehouses, the aisles are rather wide and the trucks are
easier to manoeuvre, so that the time needed to change aisles will be
roughly equal to the normal time (outside the aisles) to cover such a
distance. In a narrow aisle pallet warehouse the default additional time is
10 seconds per aisle change.
The storage strategy is a strategy by which you determine where to store
your products.
If using a random storage strategy, products are stored at an arbitrary
empty location, while the ABC storage strategy uses categories (A, B and C)
in which the products are grouped on the basis of their turnover rates.
These categories each have their own section in the warehouse. The
A-category is situated near to the depot and exists of products,
representing only a small part of the assortment, but a large part of the
picks. Whereas the C-category exists of products, representing a large part
of the assortment, but only a small part of the picks. In this way the most
wanted (and thus most picked) items are situated as near as possible to the
depot which leads to the shortest picking route. If you use an ABC storage
strategy, you have to choose between one of the two options for the layout
of the ABC-classification, which can look like this:
 ABC-1
ABC-1
 ABC-2
ABC-1 will automatically be mirrored if the depot is at the right end of the
warehouse, or symetrically grouped around the center if the depot is in the
middle.
ABC-2
ABC-1 will automatically be mirrored if the depot is at the right end of the
warehouse, or symetrically grouped around the center if the depot is in the
middle.
ABC-1
ABC-2
ABC-1 will automatically be mirrored if the depot is at the right end of the
warehouse, or symetrically grouped around the center if the depot is in the
middle.
For each of the chosen ABC layout types, the relative size of the different
storage zones has to be indicated as a percentage of the size of the whole
warehouse. Only the percentages of category A and B have to be filled in,
because C is the result of 100 minus A minus B. In layout ABC-1 it is
automatically assumed that there is at least 1 full A-aisle or 1 full
B-aisle if their category percentage is greater than 0.
When choosing the size of the zones, the minimum for the A and B zone is 1
%. If the percentage not results in a whole aisle, than a rounding has to be
completed: when a warehouse consists of 10 aisles en the A-zone is 14 %,
than the number of A-aisles will be 2 in 40 % of the simulationruns and 1 in
the other 60 % of the runs.
The percentage of picks per turnover category (A, B or C) is the percentage
of the number of picks per category compared with the total number of picks.
When category A accounts for 1100 picks a day, while the total number of
picks (those from category A, B and C) is 1650, then the percentage of picks
will be 66,7 %. The percentages for A, B and C will sum to 100 %. Only the
percentages of category A and B have to be filled in, because C is the
result of 100 minus A minus B.
The average number of lines per order is the number of lines per day divided
by the total number of orders per day.
The administration time per order consists of collecting or depositing a
pick device, obtaining or confirming a pick list, etc.
When the administration time per order is known and the time to pick an
order, then the total time to collect all items per order can be calculated.
This also enables it to make a realistic calculation of total savings per
day.
The time to pick a line is the average time, needed to pick one line. This
is the time it takes to retrieve the items from a pick location to the pick
device, which is already located in front of the pick location. In practice,
this time will be equal to the time an orderpicking truck is located in
front of the pick location from the moment the truck stops until the route
is continued.
The routing strategy only includes double sided picking strategies. Single
sided picking is in general outperformed by double sided(Goetschalckx and
Ratliff, 1998a) The routing strategy determines the sequence in which the
pick locations are visited. The efficiency of a routing strategy depends on
the order profile, the storage strategy and the lay-out of the warehouse. It
is possible to select more than one routing strategy. The routing
strategies, used here are:
- The S-Shape heuristic, in which every aisle containing pick item is traversed entirely in the shape of an S. Compared to the other heuristics, the S-Shape heuristic (also called Traversal strategy) will lead to short routes if the number of items per aisle is high. This heuristic is easy to use; when an aisle contains a pick item, the aisle is traversed completely, otherwise this aisle is skipped. This probably is the reason why this heuristic is used so frequently in practice.
- The Largest Gap heuristic, in which a picker enters an aisle as far as the largest gap. A gap is defined as the distance between two adjacent picks or between the first pick and the front aisle, or between the last pick and the back aisle. Unlike the S-Shape heuristic, the Largest Gap heuristic will lead to a short travel time if the number of items per aisle is low. The largest gap is the part of the aisle that is not visited by the order picker.
- The combined heuristic is a combination of the Largest Gap and the S-Shape heuristic, which means that an aisle either is traversed totally or entered and left from the same side of the aisle. The best option (= the shortest route) from these two opportunities is chosen, after which the next aisle is entered. These procedures are repeated until the last item is picked and the best route from the two options is chosen.
- The optimal method can calculate the shortest route, regardless of layout or location of the items. Optimal routes will typically look like a mixture of S-Shape and Largest Gap. On this site it will only be possible to calculate optimal routes for warehouses with 0 or 1 cross aisles. This method is based on the algorithm of Ratliff and Rosenthal (1983). Also Roodbergen en De Koster (1998).
In each run a random instance of the warehouse is generated in which the
pick locations are randomly distributed over the warehouse. The picking
route is calculated. In the final results the results are averaged over the
simulation runs.